
Carotid Sonography
Mindy M. Horrow, MD, FACR
Director of Body Imaging
Albert Einstein Medical Center
Philadelphia, PA
All photos retain the copyrights of their original owners
© Mindy Horrow, MD
Doppler Effect
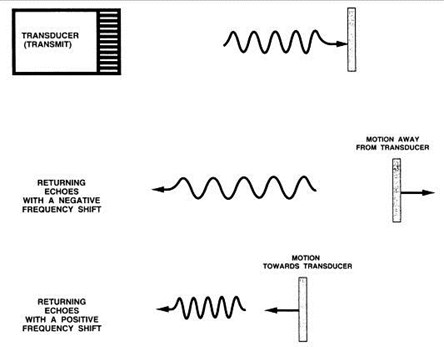
Frequency shift is proportional to velocity at which structuremoves with respect to transducer
Doppler Relationship
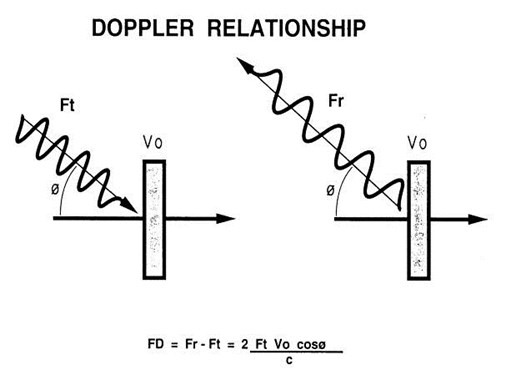
Frequency shifts caused bymoving blood are in range of human hearing
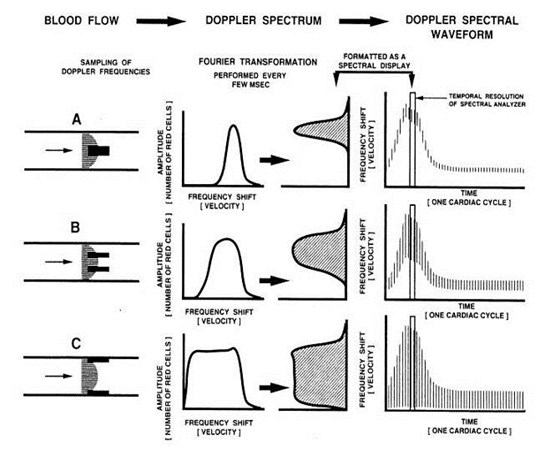
Spectrum Analysis
By Fast Fourier transformation
Frequencies returned to transducer aredecoded into component values
Creates display or distribution of velocities forgiven time interval
Intensity of returning signal proportional tonumber of rbc with same velocity
Intensity of waveform is encoded to beproportional to number of returning echoes
Duplex Sonography
Uses pulses of sound so that timedelay between transmission andreception of signal allowscalculation of distance sound hastraveled
Fourier transformation on returningechoes gives Doppler spectrum forspecific location in imaging field
Knowledge of angle between flow invessel lumen and ultrasound beampermits calculation of velocity ofmoving blood
Limitations
Next pulse can only be transmitted afterreturning echoes from previous pulse havebeen received
Pulse repetition rate sets upper limit tofrequency content of signals that areaccurately displayed after Fouriertransformation = NYQUIST LIMIT
Results in higher frequency shifts displayedat a lower frequency = ALIASING
If pulse repetition frequency increasesaliasing is less likely
Lowering frequency of transducerlowers frequency of returning echoesand increases Nyquist limit
Limitations
Color Doppler
Frequency shift information in returningpulses is decoded at multiple points onthe gray image.
Color Doppler images are created bysuperimposing this frequency shiftinformation on spatial information of grayscale image.
Color Doppler display needs several rateframes and PRF will be lower. Thusaliasing occurs at lower frequencies withcolor than pulsed Doppler
Considerations
Gray scale imaging best with beamperpendicular to interface
Doppler best between 30 and 60 degrees
–< 60 degrees because magnitude of error increasessignificantly at more obtuse angles.
–>30 degrees because shallow angle decreasesstrength of returning echoes
Equipment allows separate steering ofDoppler and gray scale images
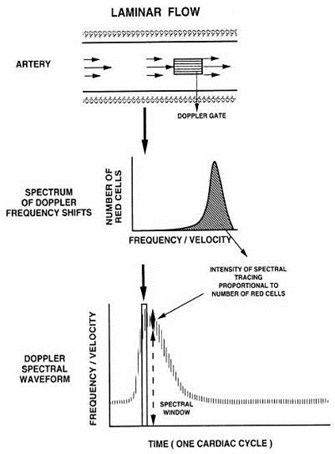
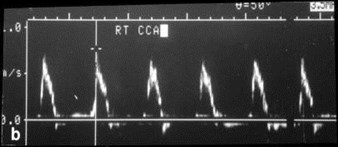
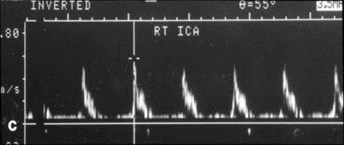
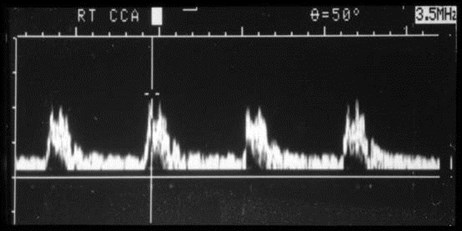
Patterns of Flow:Normal Arteries
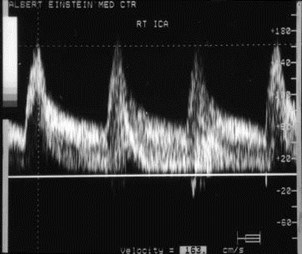
Low resistance in CCA/ICA systems
Laminar pattern with highestvelocities in center of lumen,decreasing to stagnant flow atperiphery
Perturbed at bifurcations oftortuous segments, with zone ofstagnation and even reversal
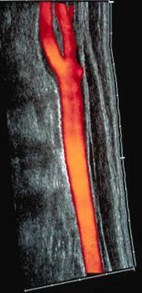
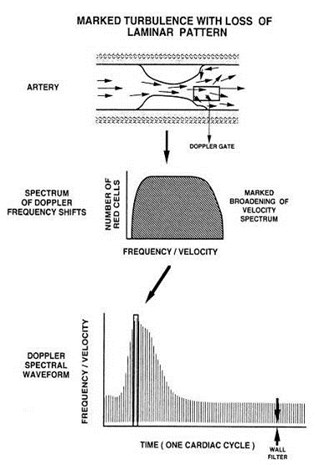
Patterns of Flow:Stenotic Arteries
Narrowed lumen causes more heterogeneousvelocities, resulting in spectral broadening whichfills in Doppler spectrum.
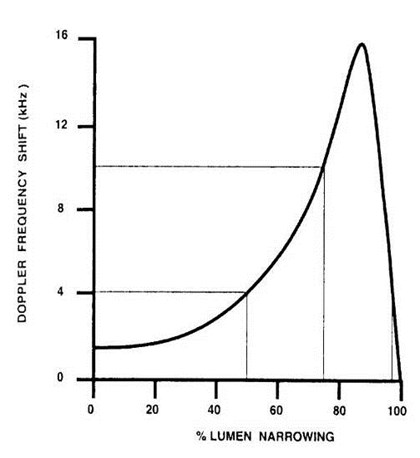
As severity of stenosis increases, so does peaksystolic velocity. At point of stenosis all rbcstend to travel with same velocity.
Distal to stenosis flow pattern is perturbed withpost stenotic jet and flow reversals.
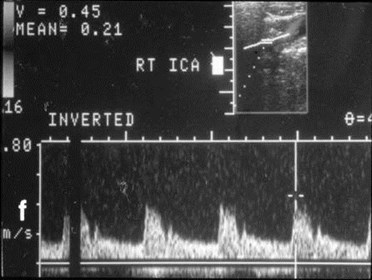
Degree of stenosis based upon peak systolic andend diastolic velocities and ratios.
Doppler Spectrum AnalysisDiagnostic Doppler Criteria forCarotid Artery Disease
DiameterCategoryPeakPeakSystolicStenosisSystolicDiastolicVelocityVelocityVelocityRatio(cm/sec)(cm/sec)(VICA/VCCA)_______________________________________________________________________________________________________________________
0%Normal< 110< 40< 1.8
1-39%Mild< 110< 40< 1.8
40-59%Moderate< 200< 60< 1.8
60-79%Severe> 200> 60> 1.8
80-99%Critical> 250> 100> 3.7
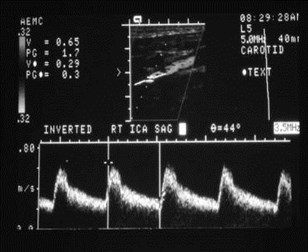
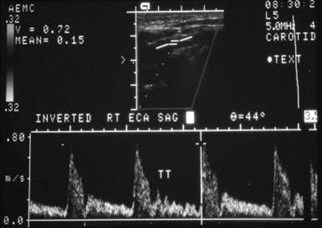
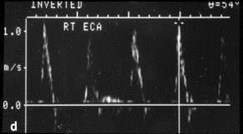
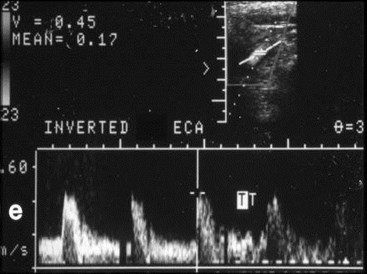
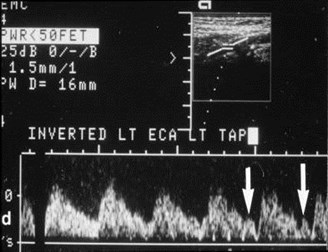
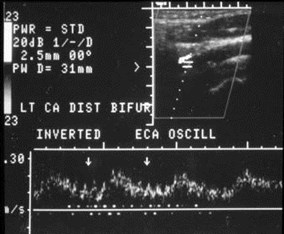
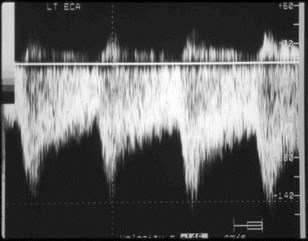
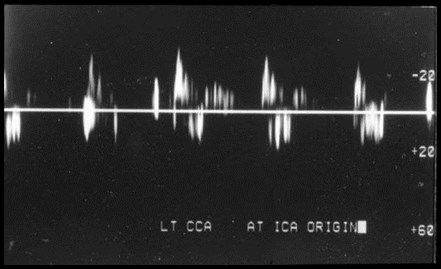
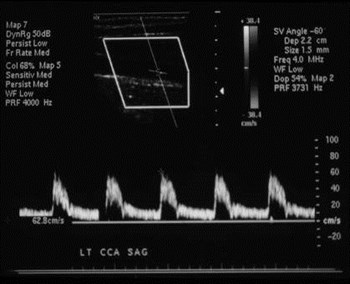
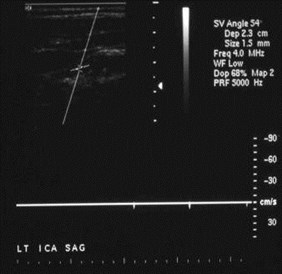
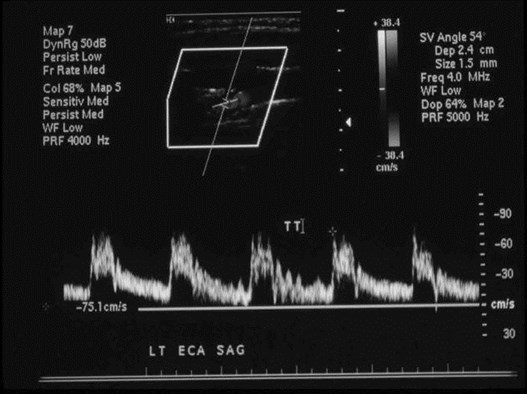
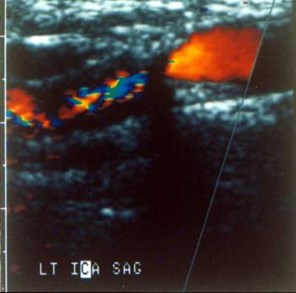
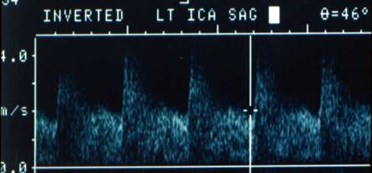
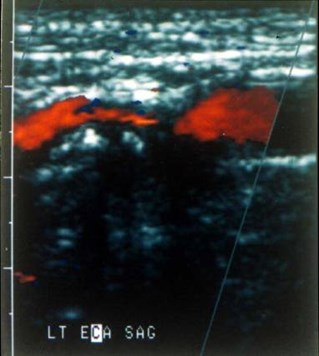
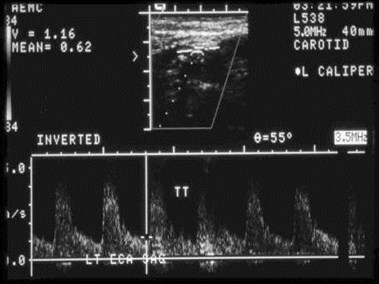
Temporal Tap
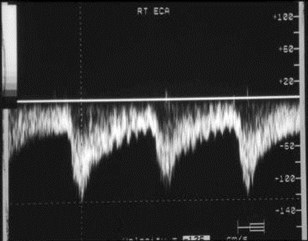
1.Digital tapping of superficial temporal arteryto distinguish ECA from ICA
2. Tap transmitted only to ECA in 40-50%
3.When ECA and ICA both had tap, ECA tapstronger in 74%
4.Likelihood of ICA with tap decreases withincreasing severity of ICA stenosis
Kliewer et al: Radiology 201:481, 1996
Budorick et al: J Ultrasound Med 15:459, 1996
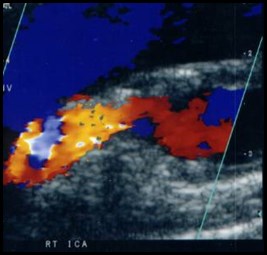
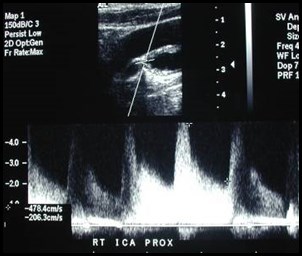
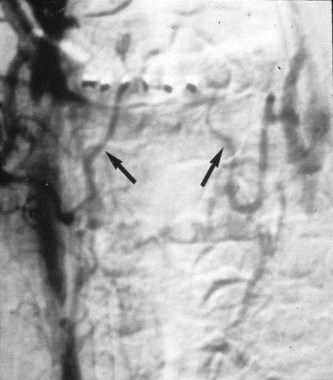
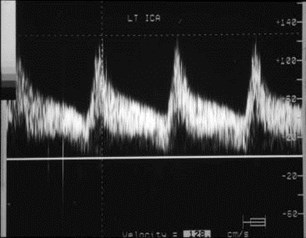
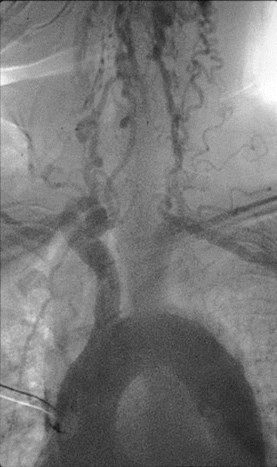
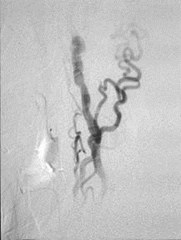
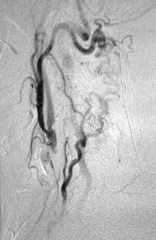
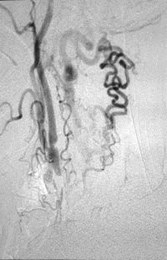
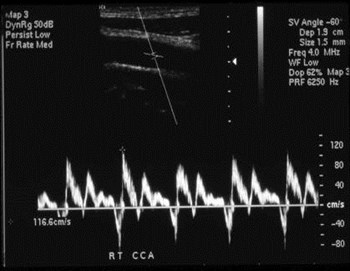
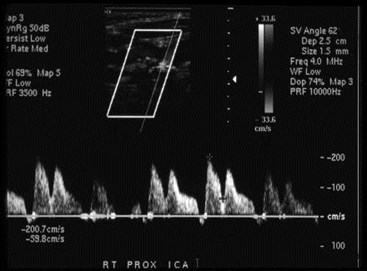
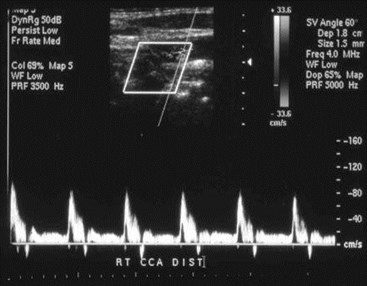
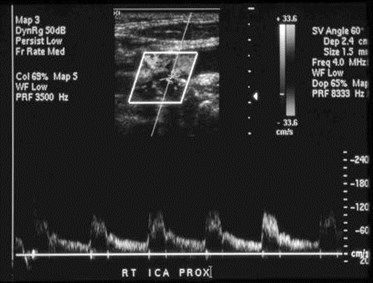
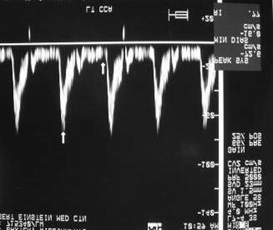
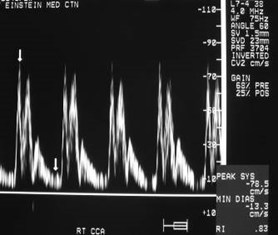
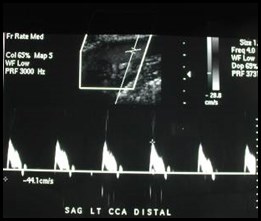
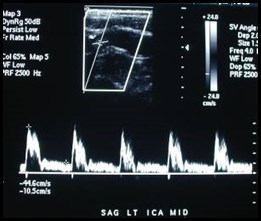
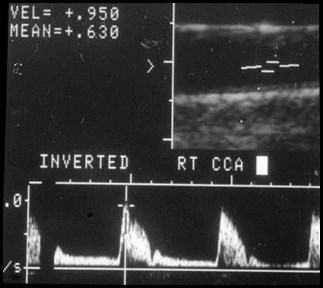
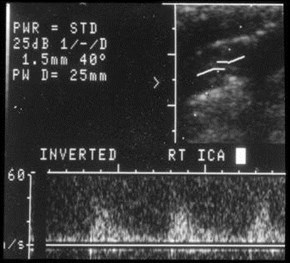
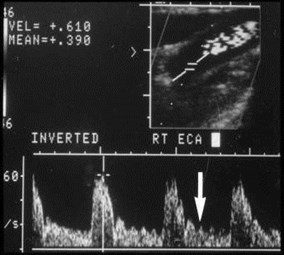
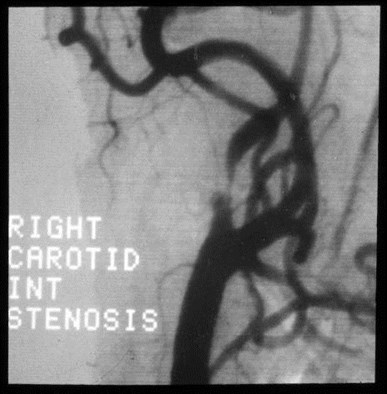
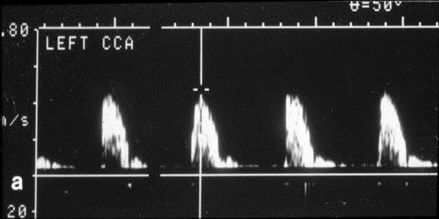
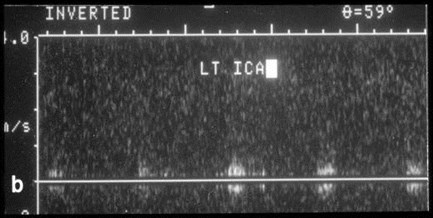
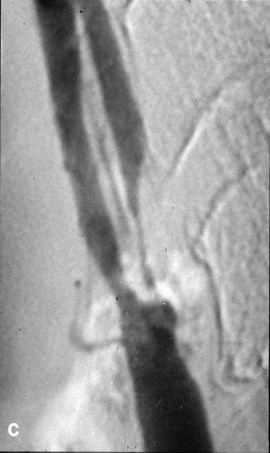
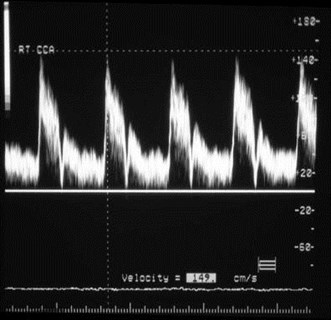
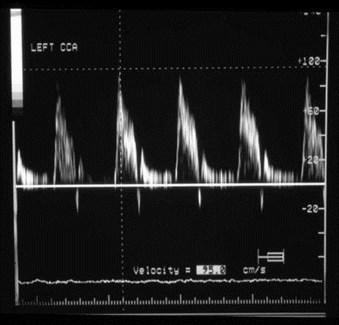
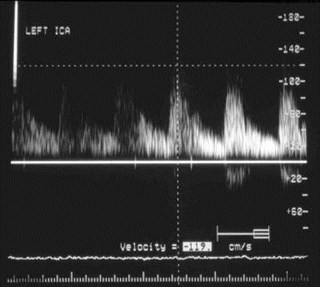
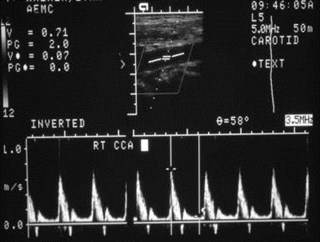
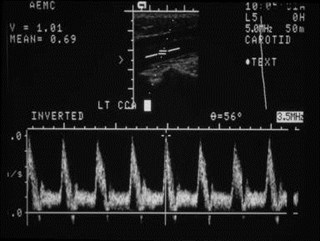
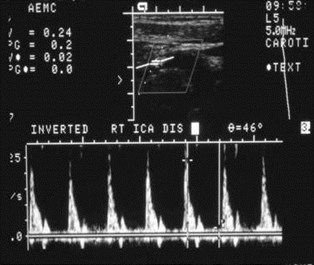
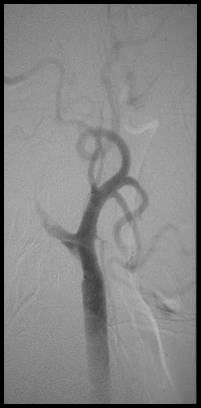
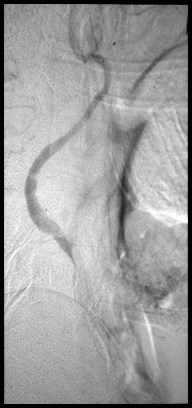
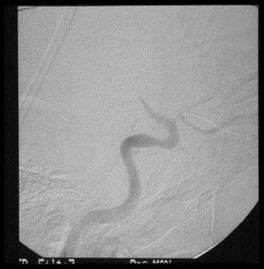
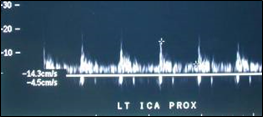
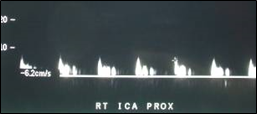
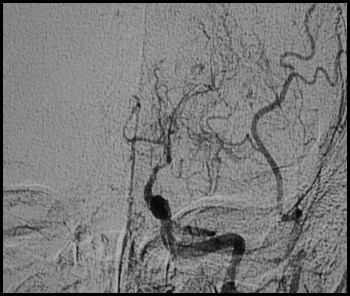
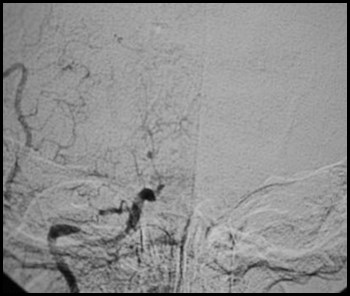
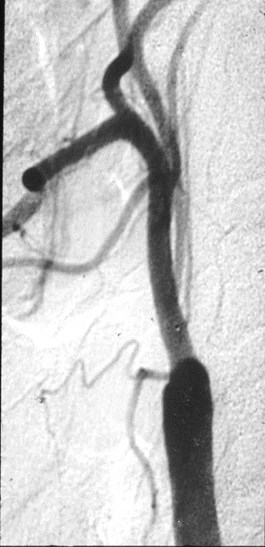
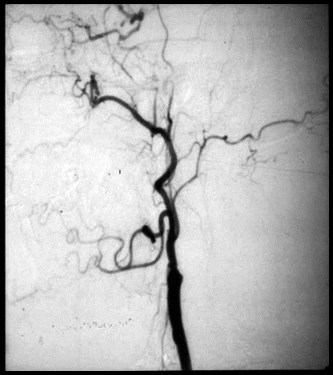
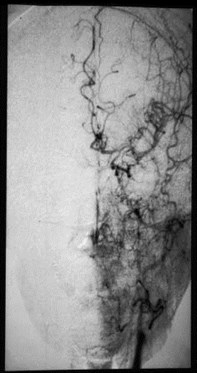
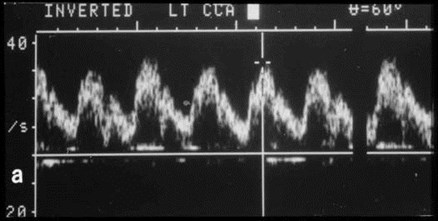
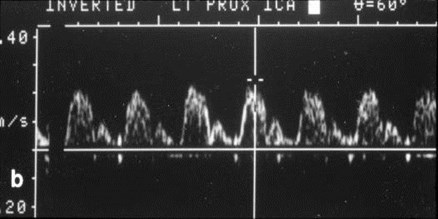
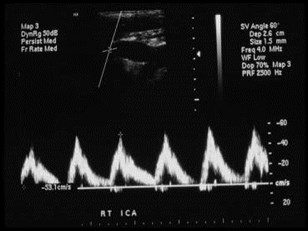
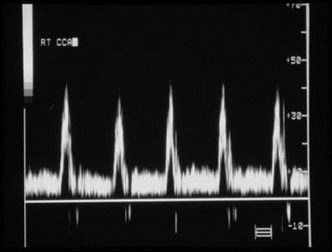
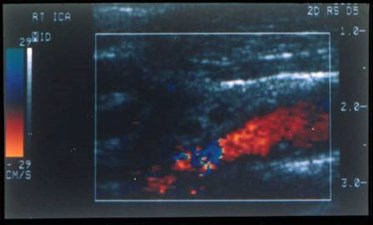
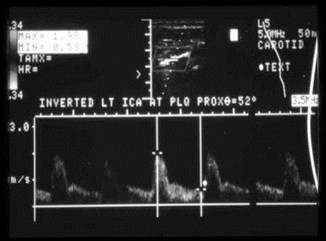
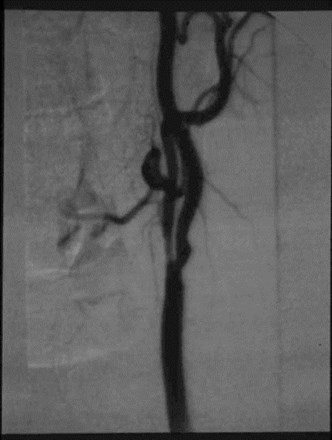
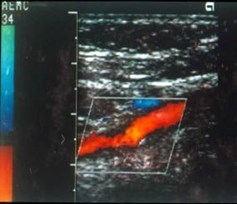
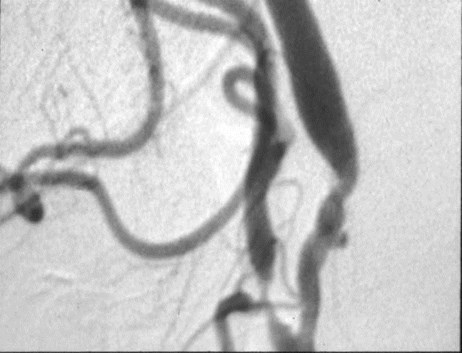
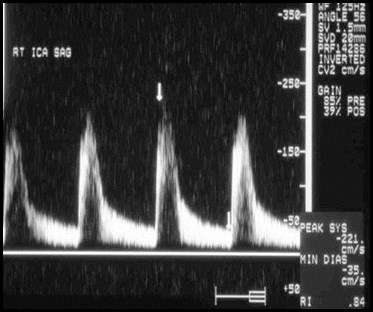
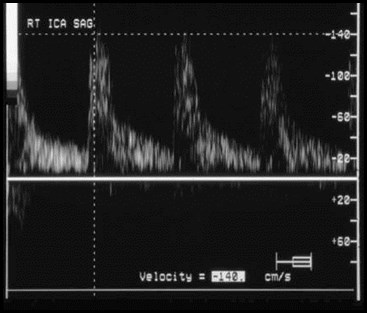
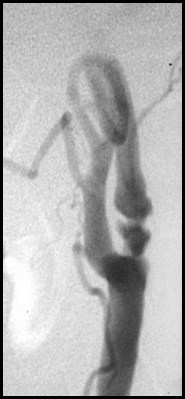
Critical Right ICA Stenosis
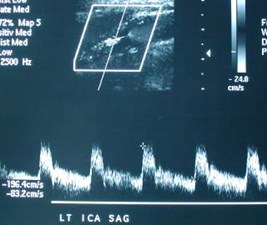
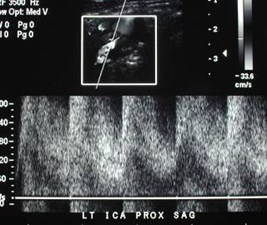
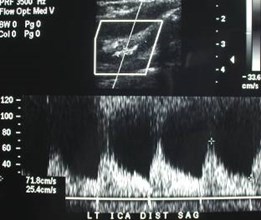
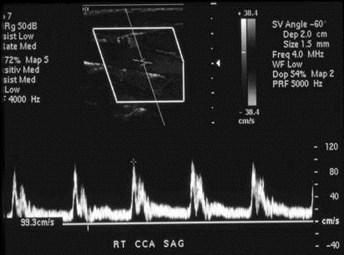
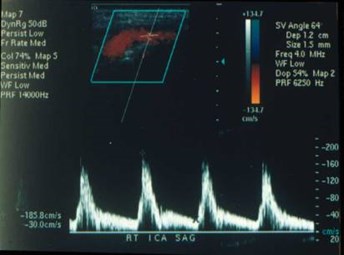
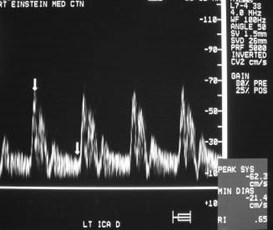
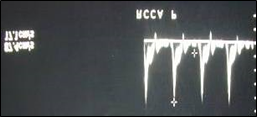
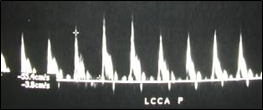
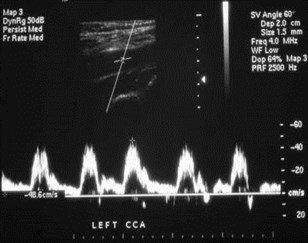
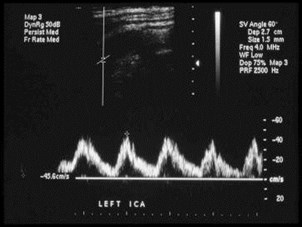
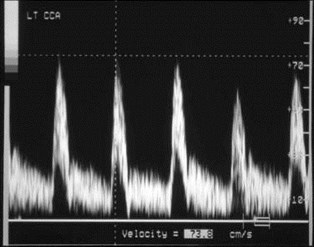
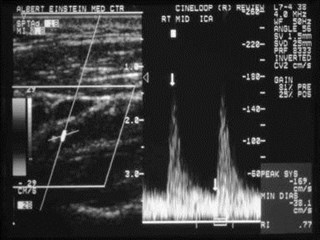
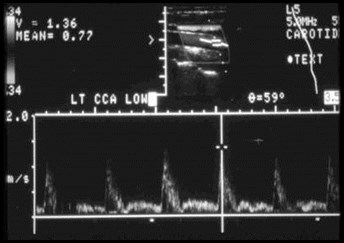
1999 moderate LICA stenosis 2001 critical LICA stenosis
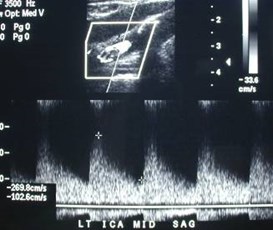
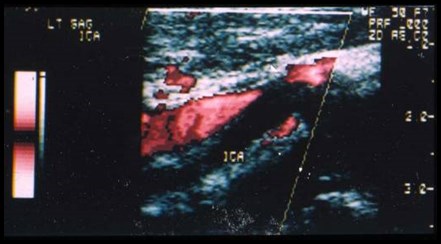
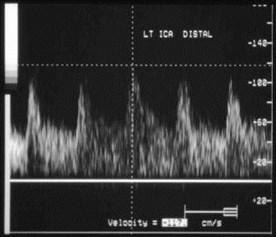
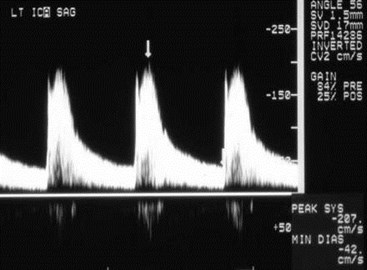
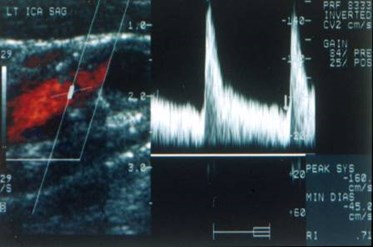
2001 mid LICA velocities 2001 distal LICA velocities
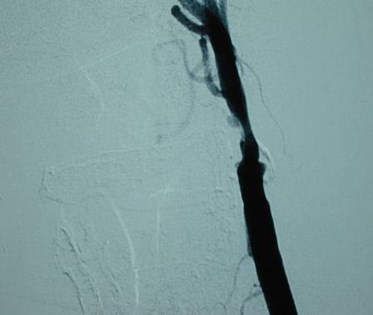
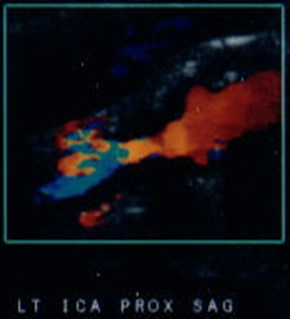
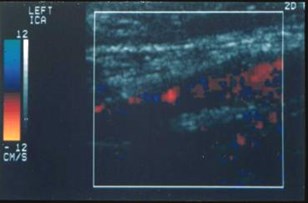
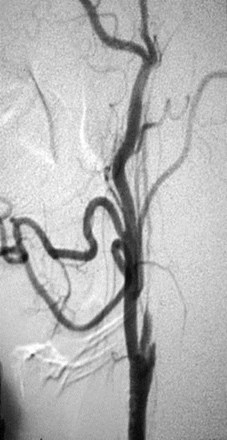
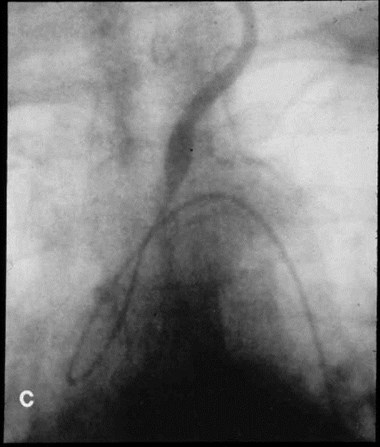
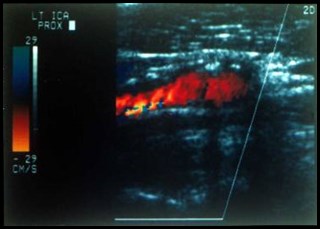
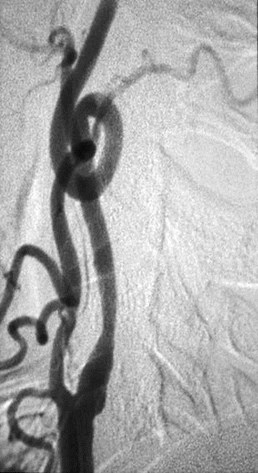
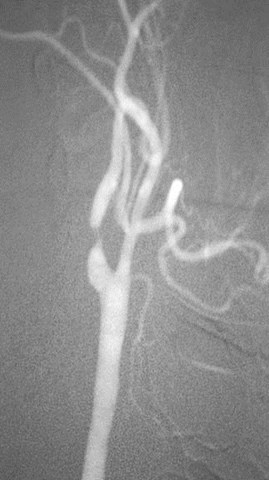
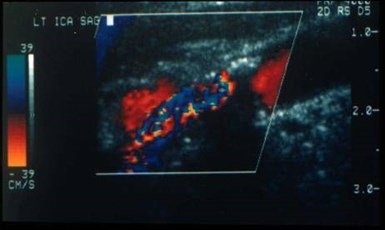
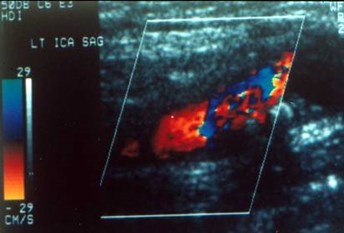
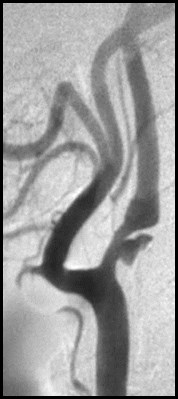
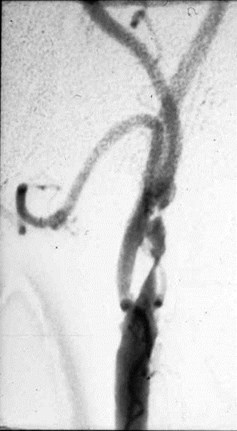
Critical LICA stenosis: angio and color Doppler
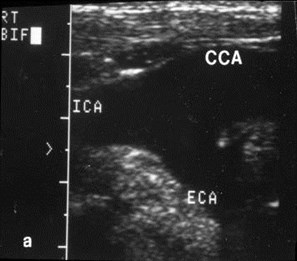
Vessel Identification
1. High vs. Low Resistance
2. Temporal Tap
3. Location
4. Branch Vessels
Vessel Misidentification
Tortuosity
Collateral pathways
Tortuous right brachiocephalicbifurcation mistaken for commoncarotid bifurcation
ICA and ECA located higher in neck
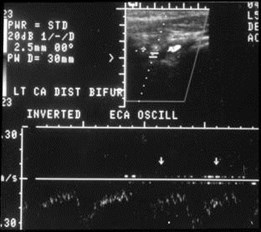
Common Carotid ArteryOcclusion
One vessel above bifurcation
Two vessels above bifurcation
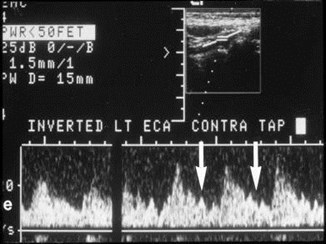
Lt ECA supplied by Rt ECA viacollaterals, so contralateral temporaltap is transmitted
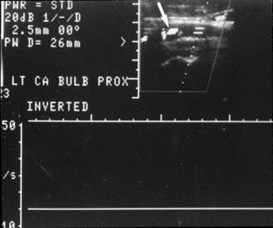
No flow inCCA
Two vessels above bifurcation, one antegrade, one retrograde
Right ECA supplies left ECA retrograde to
left ICA which is antegrade
Occlusion of both CCAs with flow in all 4 distal vessels
Occluded CCAs with collaterals toretrograde ECAs and then antegrade ICAs
UnusualVelocities
High Velocities
Youth
Tachycardia
Arrhythmias
Balloon Pump
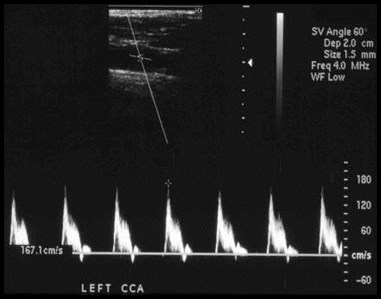
High CCA and ICA velocities with nostenosis in color Doppler in a young
Patient with vasculitis
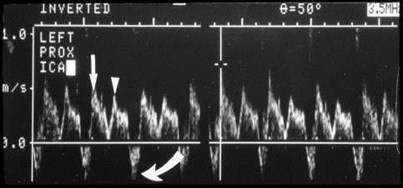
Patient on balloon pump, pre-op for CABG surgery
? RICA stenosis
Re-imaging with balloon pump off:
Normal velocities
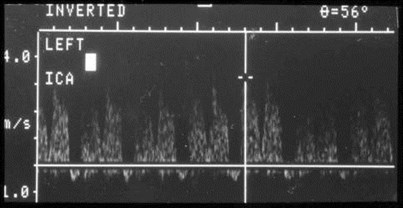
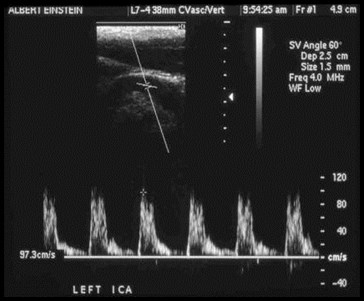
Patient on balloon pump, pre-op for CABG surgery
? LICA stenosis
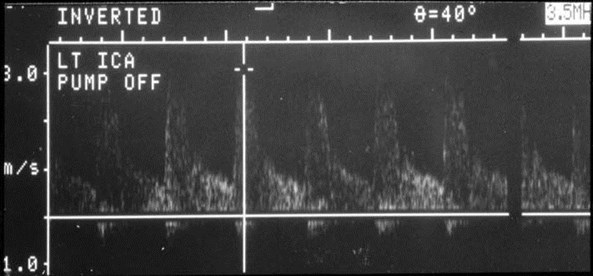
Re-imaging with pump off:
Significant LICA stenosis
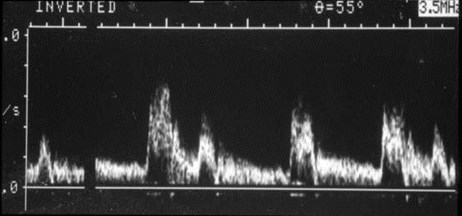
Which peak to
measure?
Wait forsinus
rhythm
Low Velocities
Diffuse
–Arrhythmias
–Cardiomyopathy
–Hypotension
–Increasedintracranial pressure
Low ICA velocities
–Near occlusion
–Distal occlusion
–Dissection
Two patients with low velocities diffusely
Tachycardia
Hypotension
Normal Carotid Ultrasound 1999
2002, change in mental status
Diffusely lower velocities and higher resistance waveforms
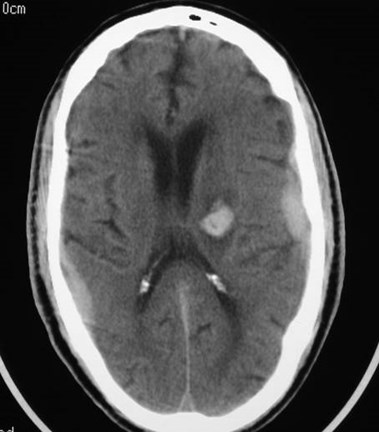
Subdural and intraparenchymal hemorrhages
Patient with critical
LICA stenosis
No flow when
hypotensive
Is there a significant
Stenosis?
Near-occlusive stenosis with low velocities
Carotid ArteryOcclusion
Positive predictive value of duplexsonography compared witharteriography
–Duplex 92.5%
–Duplex & color 96.7%
Kirsch et al: J Vasc Surg 19:642, 1994
Near or CompleteICA Occlusion
Effects on Other Vessels
–Externalization of CCA
–Internalization of ECA
Lee et al: AJNR 17:1267, 1996
Long segment, near-occlusive stenosis
Compare RCCA toLCCA
ICA dissection with
thrombosed false lumen
Normal color Doppler
With decreasing
Velocities in RICA
1 23
Distal ICA occlusion
Diffusely low velocities and high resistance waveforms
Bilateral intracranial ICA occlusions
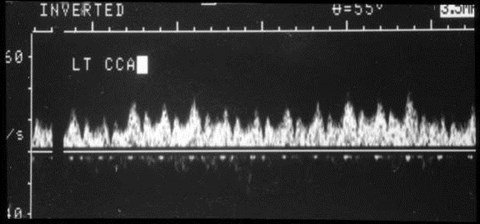
Moya-moya Syndrome
Low velocity, high
resistance LCCA=
externalized LCCA
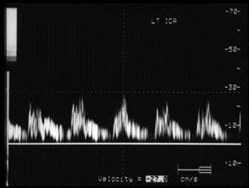
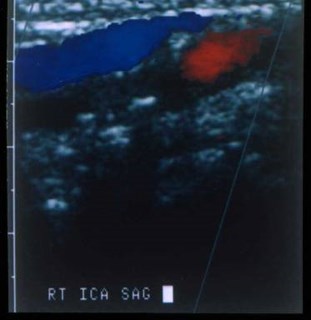
No flow in LICA
Occluded LICA
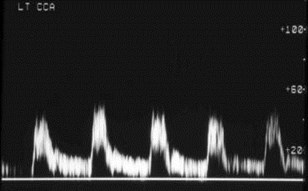
Normal, low resistance
flow in LCCA
No flow in LICA
Low resistance LECA=
Internalized LECA
Occluded LICA
Intra-cranial cross filling
UnusualWaveforms
Low Diastole in CCA
A normal variant
Aortic regurgitation
Patient with aortic regurgitation
Parvus-TardusWaveform
Tardus - pulse beat slow to rise and fall
Parvus - small pulse
Occurs
–Distal to a significant stenosis
–When vessels fill through collaterals
Kotval: J Ultrasound Med 8:435, 1989
Patient had normal right sided waveforms
High grade stenosis at LCCA origin
All waveforms are parvus tardus
Aortic Stenosis CausingParvus-Tardus Effect
Critical:100%
Severe:20%
Moderate/mild: 17%
Boyle et al: AJR 166:197, 1996
Stroke
500,000 new cases per year
150,000 deaths per year
Majority due to atherosclerosis:stenosis and/or thromboemboli
Timsit et al: Stroke 23:486, 1992
North American SymptomaticEndarterectomy Trial CollaboratorsNEJM 325:445, 1991
“Carotid endarterectomy is highlybeneficial to patients with recenthemispheric and retinal transientischemic attacks or non-disablingstrokes and ipsilateral high-gradestenosis (70 to 99 percent) of theinternal carotid artery.”
Executive Committee for theAsymptomaticCarotid Atherosclerosis StudyJAMA 273:1421, 1995
“Patients with asymptomatic carotid arterystenosis of 60% or greater reduction in diameterand whose general health makes them goodcandidates for elective surgery will have a reduced5-year risk of ipsilateral stroke if carotidendarterectomy performed with less than 3%perioperative morbidity and mortality is added toaggressive management of modifiable riskfactors.”
Accuracy of Color/DuplexCarotid Sonography
near 90%Polak et al:Radiology 173:793, 1989Neale et al:J Vasc Surg 20:642, 1994
65-71%NASCET StudyEleiasziw et al:Stroke 26:1747, 1995
Crittenden: Radiology 205:577, 1997 (Letter to the Editor)
Objective
To improve the accuracy ofcarotid duplex/color sonographycompared to angiography bydetermining avoidable andunavoidable errors.
Materials & Methods
Retrospective four year review
Cases with abnormal carotidsonograms and subsequentangiograms
Discrepancies:
–Incorrect degree of stenosis
–Incorrect location of stenosis
Materials & Methods
Angiographic Criteria for Stenosis:(considered as gold standard)
diameter at site of greatest narrowing 1 - ------------------------------------------------------ x 100% diameter at site beyond visible plaque
NASCET criteria in: Stroke 22:711-720, 1991
Results
66 complete, available sets of data
132 sides (right and left)
Complete agreement in 115 (87%)
Discrepancy in 17 (13%)
13 overcalls by sonography
3 undercalls by sonography
1 error in location
Results:Avoidable Errors
Avoidable errors in 7/17:
–Color Doppler images gave more realisticassessment of degree of stenosis in all 7
–ICA/CCA ratio would have allowedappropriate categorization of lesion in 3cases
–Unable to obtain diastolic velocities in 1case secondary to balloon pump
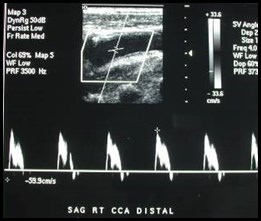
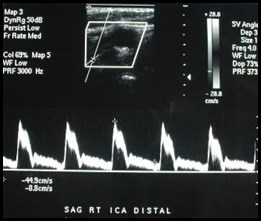
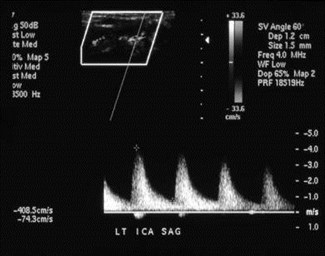
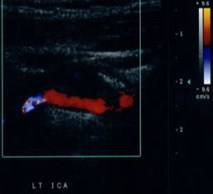
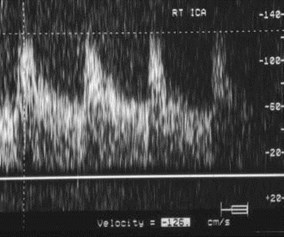
LICA
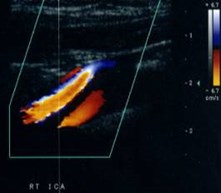
RICA
LICA mild stenosis RICA critical stenosis
Interpreted as severe LICA stenosis
based upon velocities
Peak systole 136 cm/sec Peak systole 198 cm/sec
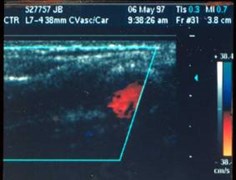
Only moderatestenosis
by angio and color
Results:Unavoidable Errors
Unavoidable errors in 10/17:
–7 cases with contralateral, significantlesions (5 occlusions) resulted insonographic overcall
–3 cases - angiography showed longulcerated plaques and tortuousvessels
Overestimation of Stenosiswith ContralateralSevere Disease or OcclusionBeckett et al: AJR 155:1091, 1990AbuRahma et al: J Vasc Surg 22:751, 1995Busuttil et al: Am J Surg 172:144, 1996
Occluded RICA and critical stenosis LICA
Critical LECA stenosis
Systole 450 cm/sec
Diastole 116 cm/sec
Angiography: severe LICA and critical
LECA stenoses
ICA
ECA
Patient underwent endarterectomy
for symptomatic severe LICA stenosis
Contralateral peak systolicvelocities
Pre LCEA: 221 cm/sec Post LCEA: 140 cm/sec
Moderate LICA stenosis?
Severe LICA stenosis with
large ulcer in tortuous vessel
Conclusion
“We Can Do Better”
The key to improvement
is the color image
Conclusion
Sonography incorrect insmall percentage
May be able to predict thissubset and obtain MRA orconventional angiography
Familiarity with types oferrors should help todecrease their frequency
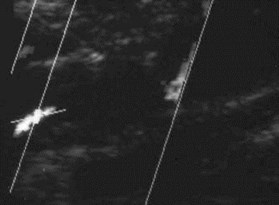
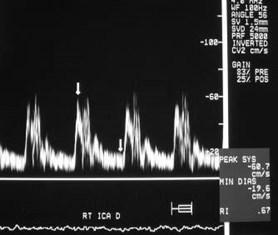
Doppler after densely
shadowing plaque
? Degree of stenosis
Critical RICA stenosis
Bibliography
Horrow MM, Stassi J, Shurman A, BrodyJD, Kirby CL, Rosenberg HK: Thelimitations of carotid sonography:Interpretive and technology-related errors.AJR 174:189-194, January 2000.
Stassi J, Horrow MM, Rosenberg HK, KirbyCL: Carotid ultrasonography: Interpretiveissues and potential pitfalls.Ultrasound Quarterly 14: 48-64, 1998.
The End